 They are similar to those of the Electrical Power station, although much modest
in its reaches:
They are similar to those of the Electrical Power station, although much modest
in its reaches:
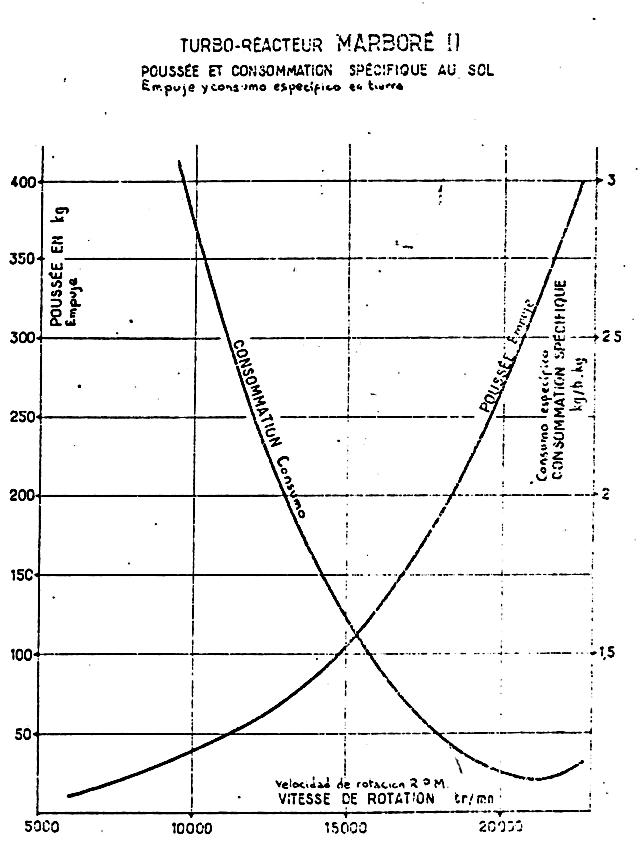
The left graph is the original map of performances from the turbojet's builder (Courtesy of Francisco Erjavec, of the Astazou work group).
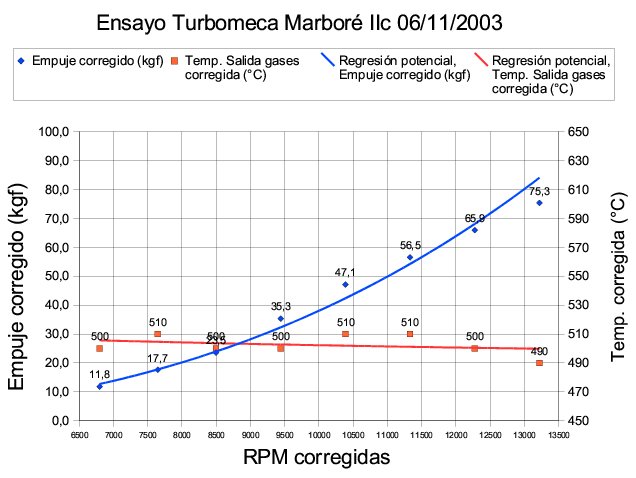
In a similar way to what happens with the electrical power station or a reciprocating engine, the reading of parameters as thrust, consumption and temperature; all based on the number of revolutions per minute (RPMs) will allow to determine the efficiency, first by direct comparison with the graph of the left, and later making some calculations as to have an idea of how much of the burned fuel becomes thrust finally.
And in an opposed way to the cases previously mentioned, due to the high fuel consumption and to its cost, this is a test we have planned to be made in not more than 5 minutes with the necessary coordination of 5 people.
From end of 2003 we count with the capacity to measure thrust, and by 2004 beggining we will conclude the necessary adjustments to be able to measure the turbojet's consumption. The following spread data and graph correspond to the first test made at November 06th of 2003 over Marboré IIc:
|
RPM |
7200 |
8100 |
9000 |
10000 |
|
Thrust (kgf) |
12,5 |
18,8 |
25,0 |
37,5 |
|
Gasses temperature (°C) |
520,0 |
530,0 |
520,0 |
520,0 |
|
|
|
|
|
|
|
Corrected RPM |
6799 |
7649 |
8498 |
9443 |
|
Corrected thrust (kgf) |
11,8 |
17,7 |
23,5 |
35,3 |
|
Corrected temperature (°C) |
500 |
510 |
500 |
500 |
|
|
|
|
|
|
|
Ambient temperature (°C) |
35,0 |
|
|
|
|
Atmospheric presure (hPa) |
1010,2 |
|
|
|